Car Resale Value Prediction Using Random Forest Regressor
Leading organizations are collecting tons of data every day to derive business decisions and solutions from it. With this huge amount of data, demand for Data Scientists and Data analysts is massively increasing. Machine Learning and Artificial Intelligence are transforming the world for a better tomorrow. Data is the new “oil” of this 21st century, and Machine Learning is the technology built over it.
Nowadays, Machine Learning and Artificial Intelligence are applicable in almost every sector. Companies are adopting smart AI solutions in their product to eliminate manual interventions. Let’s keep ourselves confined to cars, and we will see how it has changed the driving experiences.
Application of Machine Learning in the Automotive Industry
In the automotive industry, machine learning is most often associated with product innovations. More than 78 % of automotive companies invest in Machine Learning to regularly improve their user experience. Let’s take a look at such available solutions:
Autonomous Cars: Companies like Tesla has already implemented the self-driving feature in their cars. Tesla relies on its complex Computer Vision Algorithms and Sensors to gain full control over roads. Machine Learning allows self-driving cars to adapt to changing road conditions instantaneously.
Real-Time Car Parking: There is a tremendous increase in the number of vehicles, and with the increasing number of cars, parking problems arise. Smart Parking Systems has been addressing such problems by leveraging the power of Machine Learning and IoT devices. The system minimizes human intervention and saves time, money, and energy.
Preventive Maintenance Indicator: Every durable utility requires some timely maintenance; cars are no exception! A car requires adequate oil and coolant levels, air filter cleaning, and optimum tire pressure. ML and IoT-based Predictive Maintenace models help in keeping track of such requirements.
Root Cause Analysis: Car Servicing companies use Machine Learning based systems for root cause analysis of car break-down events. These systems can analyze a huge stream of historical and current information, find anomalies and invisible patterns, and draw conclusions about a certain breakdown.
These are some applications of Machine Learning in the Automotive industry. However, In this blog, we will tackle a relatively simpler problem that is predicting the resale value of used cars using Regression analysis.
Now, let’s start by understanding the problem statement!
Understanding Problem Statement
Machine Learning has become a tool used in almost every task that requires estimation. Companies like Cars24 and Cardekho.com uses Regression analysis to estimate the used car prices. So we need to build a model to estimate the price of used cars. The model should take car-related parameters and output a selling price. The selling price of a used car depends on certain features as mentioned below:
- Fuel Type
- Manufacturing Year
- Miles Driven
- Number of Historical Owners
- Maintenance Record
This is a supervised learning problem and can be solved using regression techniques. We need to predict the selling price of a car based on the given car's features. Supervised Regression problems require labeled data where our target or dependent variable is the selling price of a car. All other features are independent variables.
Following are some regression algorithms that can be used for predicting the selling price.
- Linear Regression
- Decision Tree Regressor
- Support Vector Regressor
- KNN Regressor
- Random Forest Regressor
Linear Models are relatively less complex and explainable, but linear models perform poorly on data containing the outliers. Linear models fail to perform well on non-linear datasets. In such cases, non-linear regression algorithms Random Forest Regressor and XGBoost Regressor perform better in fitting the nonlinear data.
In this tutorial, we will use Random Forest Regressor for predicting the selling price of cars. Our data contains some outliers, and treating them is entirely possible, but the performance of nonlinear regression models is insensitive to outliers.
Data Analysis
This section performs the Selling price prediction using a dataset consisting of 8,128 used car details. This dataset is prepared by Cardekho.com and available on Kaggle.
import pandas as pd
cars = pd.read_csv("car_data.csv")
cars.head(5)
We have some categorical objects as well as continuous features here.
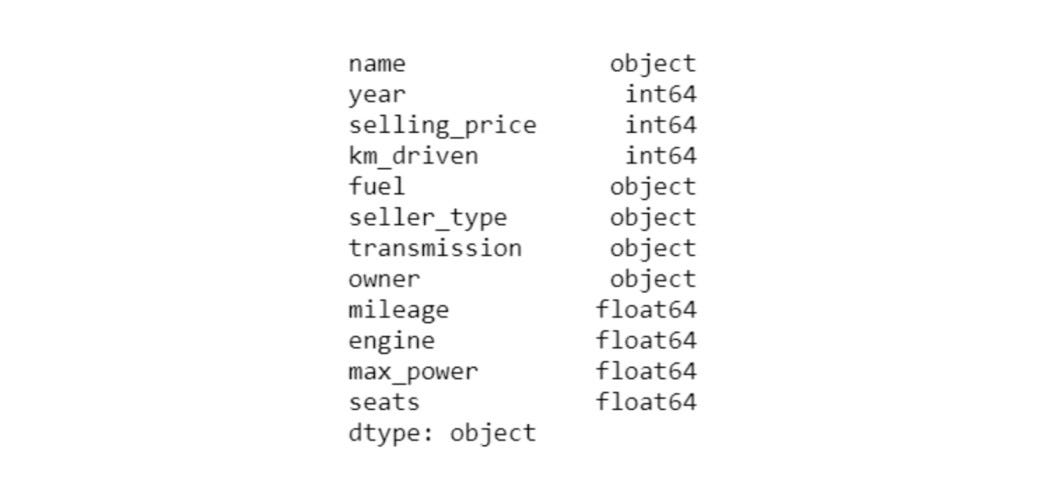
Price Distribution for Different Fuel Type Cars
Let’s visualize the price of cars versus the car fuel type.
sns.kdeplot(cars.loc[(cars['fuel']==label), 'selling_price'],
            color=clr, shade=True, label=label)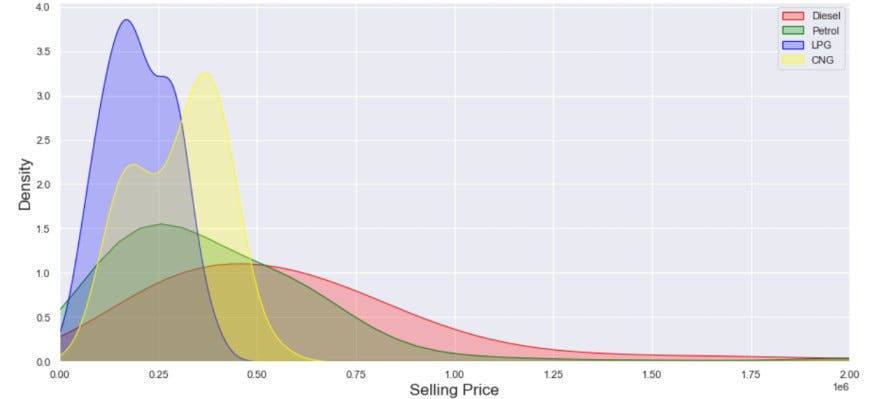
Selling Price Distribution for Different Fuel Type Cars
Insights: Diesel Fuel type cars are generally more expensive than petrol cars; the above plot supports our intuition. Gas fuel-type cars are relatively cheaper. CNG cars have a slight advantage over LPG cars in terms of fuel consumption and storage, and thus, the price of CNG cars is relatively higher than LPG cars.
Correlation Matrix
Visualizing the correlations is an effective way of determining the dependencies. In the given plot, the selling price has a high correlation with the manufacturing year, engine, max power, and transmission. The Engine and Manufacturing year has the same approximate correlation, so we can select any one of them in the final set of features.
sns.heatmap(data = cars.corr(), cmap="YlGnBu", square=True)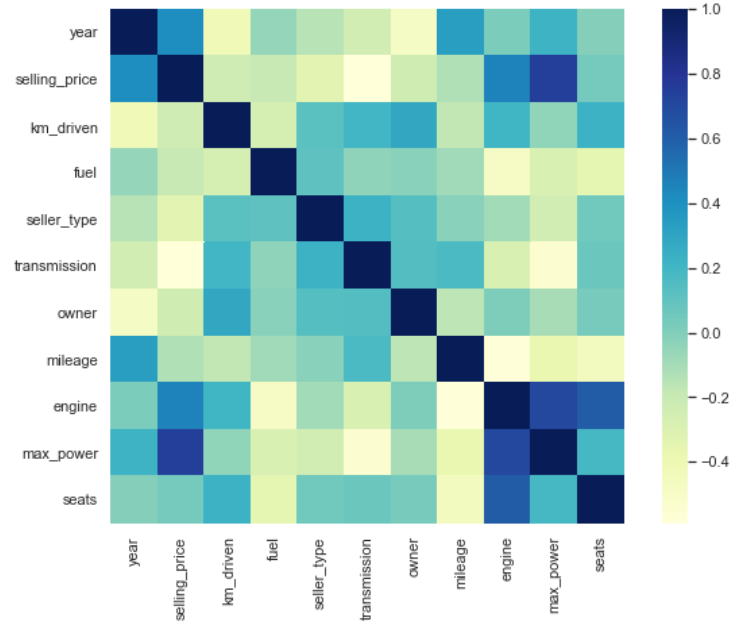
Correlation Heatmap
Pair Plot
A pairs plot allows us to see both distributions of single variables and relationships between two variables. Pair plots are a great method to identify trends for follow-up analysis and, fortunately, are easily implemented in Python!
sns.pairplot(cars[["selling_price", "km_driven", "engine", "mileage",
                   "max_power", "owner"]], hue="owner")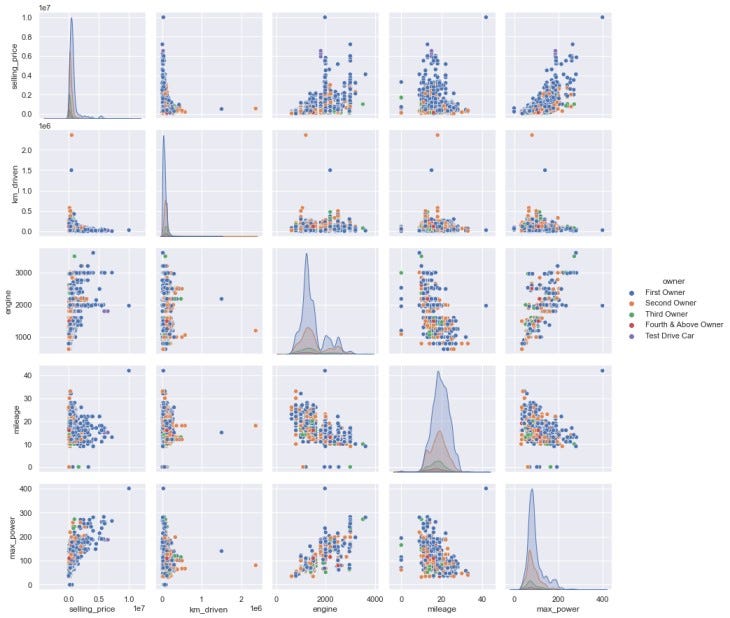
Pair Plot
As ownership is increasing, almost all the parameters are decreasing. For instance, the mileage of cars owned by the first owner is relatively higher than subsequent owners. The same goes for max power, engine, and km driven. This is also very intuitive!
Scatter plots in pair plots also help in the visualization of Outliers. Our data contains some minor outliers that we can safely ignore.
Random Forest Regression
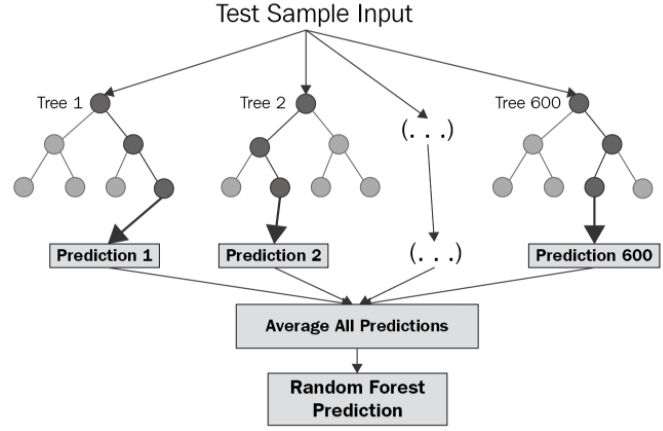
Random Forest is a supervised learning algorithm that uses an ensemble learning approach for regression and classification. The main principle behind the ensemble methods is that Weak learners can form strong learners. Random Forest operates by constructing multiple decision trees at training time. These decision trees are independently trained on bootstrapped datasets. The final predicted value is calculated by taking the mean of predictions by all the individual trees.
Fitting the Model
Before building the model, we need to split the dataset into training and testing sets. We will make use of this test set for evaluating the performance of the model.
from sklearn.ensemble import RandomForestRegressor
from sklearn.model_selection import train_test_split
target = cars['selling_price']
features = cars[cars.columns.difference(['selling_price'])]
#---Creating the training and testing dataset
X_train, X_test, Y_train, Y_test = train_test_split(features, target, test_size=0.3)
#---Loading the baseline Random Forest Regressor
rf = RandomForestRegressor()
#---Fitting the data over training set
rf.fit(X_train, Y_train)
#---Evaluating the performance over testing set
rf_confidence = rf.score(X_test, Y_test)
print("rf confidence: ", rf_confidence)
# rf confidence:  0.96997
Performance Evaluation
In statistics, the coefficient of determination a.k.a “R squared”, is defined as the proportion of the variation in the dependent variable that is predictable from the independent variable(s). In our case, R squared is closer to 1, which indicates that the model is reliable in predicting the selling price. Random Forest is known for attaining high accuracy even without hyper-parameter tuning.
Residuals
A residual is a measure of how far away a point is vertically from the regression trend. Simply, it is the error between a predicted value and the observed actual value.
visualizer = ResidualsPlot(rf)
visualizer.fit(X_train, Y_train)
visualizer.score(X_test, Y_test)
visualizer.show();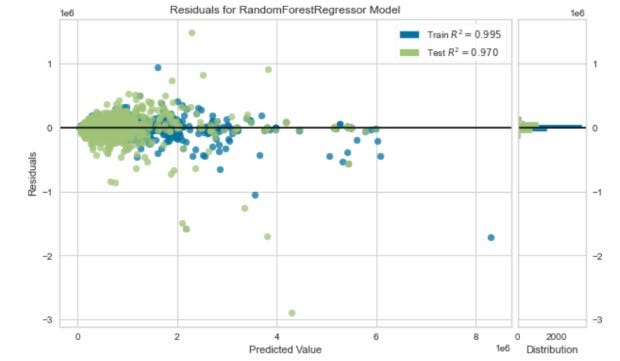
Residual Plot
Residuals are centered around zero, and the coefficient of determination “R-squared” is close to 1.
Pros and Cons of Random Forest Regressor —
Pros:
- Good at learning complex and non-linear relationships
- Highly explainable and easy to interpret
- Robust to outliers
- No feature scaling is required
Cons:
- Consumes more time
- Requires high computational power
Application of Regression Analysis
CARS24
CARS24 is India’s fast-growing auto-tech company to buy and sell used cars. CARS24 aligns well with what we have achieved here as they heavily rely on the Regression Algorithms to estimate the price of a used car for both selling and buying purposes. They also use regression for estimating the fuel efficiency of cars.
AMERICAN EXPRESS
Random Forest Regression is frequently used by American Express to predict the creditworthiness of a loan applicant. This helps the American Express lending team to make a good decision on whether to give the customer the loan or not.
MERK & CO.
MERK uses regression analysis to identify the optimal combination of components in medicine and analyze a patient’s medical history to identify diseases. Past medical records are reviewed to establish the right dosage for the patients.
Interactive Brokers LLC
Interactive Brokers LLC is an American multinational brokerage firm. Their stock trading application uses Random Forest Regressor to predict the estimated loss or profit while purchasing a particular stock.
Possible Interview Questions
- How is Random Forest Classifier different from Random Forest Regressor?
- What is an ensemble learning approach?
- How will you ensure that your model is not getting overfitted?
- What techniques will you use to cure the problem of overfitting?
- Which input feature is affecting the car price the most?
Conclusion
We started with understanding the use case of machine learning in the Automotive industry and how machine learning has transformed the driving experience. Moving on, we looked at the various factors that affect the resale value of a used car and performed exploratory data analysis (EDA). Further, we build a Random Forest Regression model to predict the resale value of a used car. Finally, we evaluated the performance of the model using the R squared score and Residual Plot.
We could have also used simpler regression algorithms like Linear Regression and Lasso Regression. Still, we need to make sure there are no outliers in the dataset before implementing them. Pair plots and scatter plots help visualize the outliers.
Enjoy Learning, Enjoy Algorithms!
Share Your Insights
More from EnjoyAlgorithms
Self-paced Courses and Blogs
Coding Interview
OOP Concepts
Our Newsletter
Subscribe to get well designed content on data structure and algorithms, machine learning, system design, object orientd programming and math.
©2023 Code Algorithms Pvt. Ltd.
All rights reserved.
